This blog post is part of a series describing my ongoing analysis of the Kaggle Horses For Courses data set using Azure Data Lake Analytics with U-SQL and Azure Notebooks with F#. This is part 3.
- Horses For Courses data set analysis with Azure Data Lake and U-SQL
- Horses For Courses barrier analysis with Azure Notebooks
- Kaggle Horses for Courses age analysis with Azure Notebooks (this blog post)
- Kaggle Horses for Courses analysis of last five starts with Azure Notebooks
Data set and recap
A quick recap of Kaggle and the data set we're analyzing: Horses For Courses. Kaggle is a data science and machine learning community that hosts a number of data sets and machine learning competitions, some of which with prize money. 'Horses For Courses' is a (relatively small) data set of anonymized horse racing data.
In the first post I discussed how you could use Azure Data Lake Analytics and U-SQL to analyze and process the data. I used this mainly to generate new data files that can then be used for further analysis. In the second post I studied the effect of the barrier a horse starts from on its chances of winning a race.
In this post I'm going to do the same but now for age: how does the age of a horse affect its chances of winning a race. The analysis will again be based on a file that was generated from the raw data using a U-SQL script in Azure Data Lake. The file has a very simple format: column 1 has the age of the first horse, column 2 of the second horse and column 3 tells us who won in a particular race. So for example:
3,7,True
10,4,False
The first row tells us that in a particular race, a 3-year-old horse beat a 7-year-old horse. The second row tells us a 10-year-old horse got beaten by a 4-year-old.
The analysis will again be performed using an Azure Notebook with an F# kernel. Here is the link to my notebook library.
Ages notebook
As in the previous post, the details can be found in the accompanying Azure Notebook. You can clone the notebook library using a Microsoft account. Remember that Shift+Enter is the most important key combination; it executes the current cell and moves to the next cell.
The first thing we'd like to know is how many horses there are for a particular age. This information can be found in the raw data from Kaggle: horses.csv. If we plot the results we get the following:
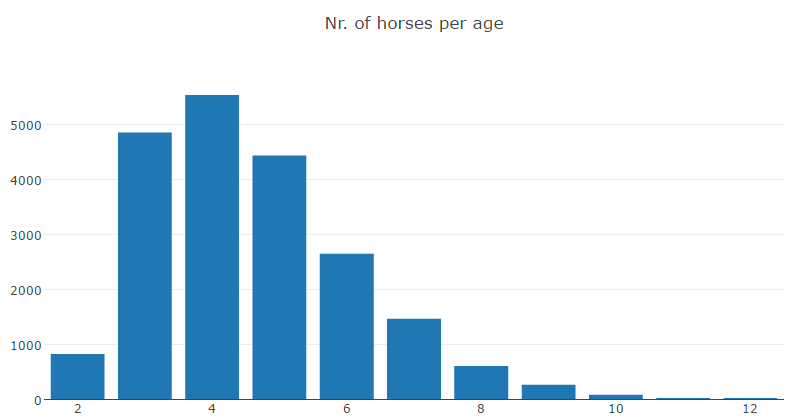
You can see that for ages 3, 4, 5, 6 and maybe 7 we have a reasonable amount of data.
The next step is analyzing the ages.csv file we generated that has one row for each age combination in each race. For this we apply a similar tactic as we used in the previous post: check for each age how many times a horse from that age beat horses from other ages. This results in the following matrix:
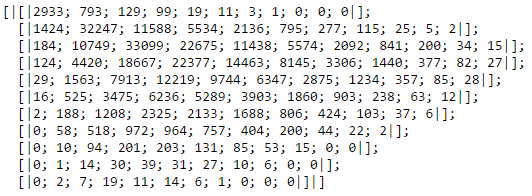
Some examples to clarify what we see here:
- On the first row we see how many times 2-year-old horses beat other horses. So 2-year-old horses beat 3-year-old horses 793 times, they beat 4-year-old horses 129 times, etc.
- On the second row we have the 3-year-old horses. They beat 2-year-old horses 1424 times, other 3-year-old horses 32247 times, 4-year-old horses 11588 times, etc.
The absolute numbers in this matrix do not tell us a lot, since they are skewed by the number of horses of a particular age that actually ran races. So what we do next is divide the number of wins by the number of losses per age pair: the win-loss ratio. These are the numbers for ages 2 to 7:
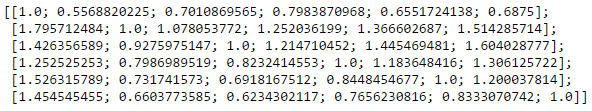
The second value in the first row is obtained by dividing 793 by 1424. The first value in the second row is its inverse: 1424 divided by 793. Now let's visualize the data. I started out with a 3D surface plot (as in the previous post) but that got a bit convoluted so I used simple line charts instead:
Conclusions
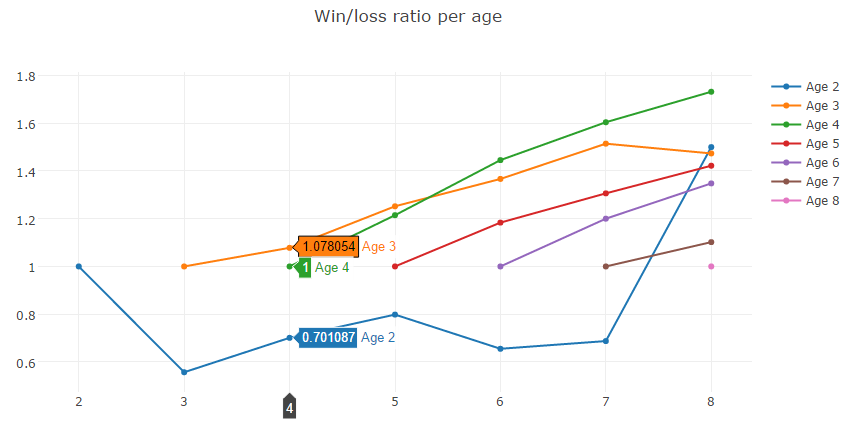
In the plot I compared ages 2 to 8. I highlighted the results of 2, 3 and 4 year old horses against other 4-year-olds. So, for example, you can see that a 2-year-old horse has a win/loss ratio of 0.701087 against 4-year-old horses. What is obvious is that younger horses outperform older horses (except for 2-year-old horses): 3-year-old horses have a positive win/loss ratio against any other age.
However, if we take the positive win/loss ratio of 1.078054 of 3-year-olds against 4-year-olds, it doesn't really help us predict horse races. If we revisit the absolute numbers, we can see that 3-year-olds beat 4-year-olds 11588 times, but 4-year-olds beat 3-year-olds 10749 times.
But still, the effect of age is obvious so there must be some way to use it in predicting race outcomes. Maybe instead of age we could use the win/loss ratio directly. However, we may loose information if we reduce ages 2 and 4 in each race to the number 0.701087. Maybe age combined with another feature is a strong predictor for race outcomes. For example, maybe 2-year-old horses perform very well on muddy race tracks. By reducing age pairs to just a win/loss ratio this information may be lost.
So even if age is a factor to consider, I doubt whether it is actually useful as direct input for a machine learning algorithm.